Here’s how to choose a filter press size: calculate your dry solids load, convert it to cake volume per cycle, and verify the filtration area with slurry testing. Then choose a plate size and chamber count that meet both requirements within your actual operating schedule.
| Parameter | Example value | Basis |
|---|---|---|
| Slurry volume | 20 m³/day | Assumed normal feed |
| Feed dry solids | 5% by mass | Assumed concentration |
| Slurry density | 1,050 kg/m³ | Illustrative input; measure on actual feed |
| Cake dry solids | 35% by mass | Assumed achievable endpoint |
| Wet cake bulk density | 1,250 kg/m³ | Assumed property at that endpoint |
| Completed cycles | 4 per day | Assumed operating schedule |
| Dry solids load | 1,050 kg/day | Calculated from normal feed |
| Required cake volume | 600 L/cycle | Calculated before load allowance |
| Design chamber volume | 720 L/cycle | Calculated for 20% more feed at unchanged properties |
A press can have enough room for the cake and still take too long to process the liquid. That’s why a useful sizing decision needs both a solids balance and a time check.
The example above shows the method. Its numbers are assumptions for teaching the calculation, not measured plant results or a guaranteed equipment specification.
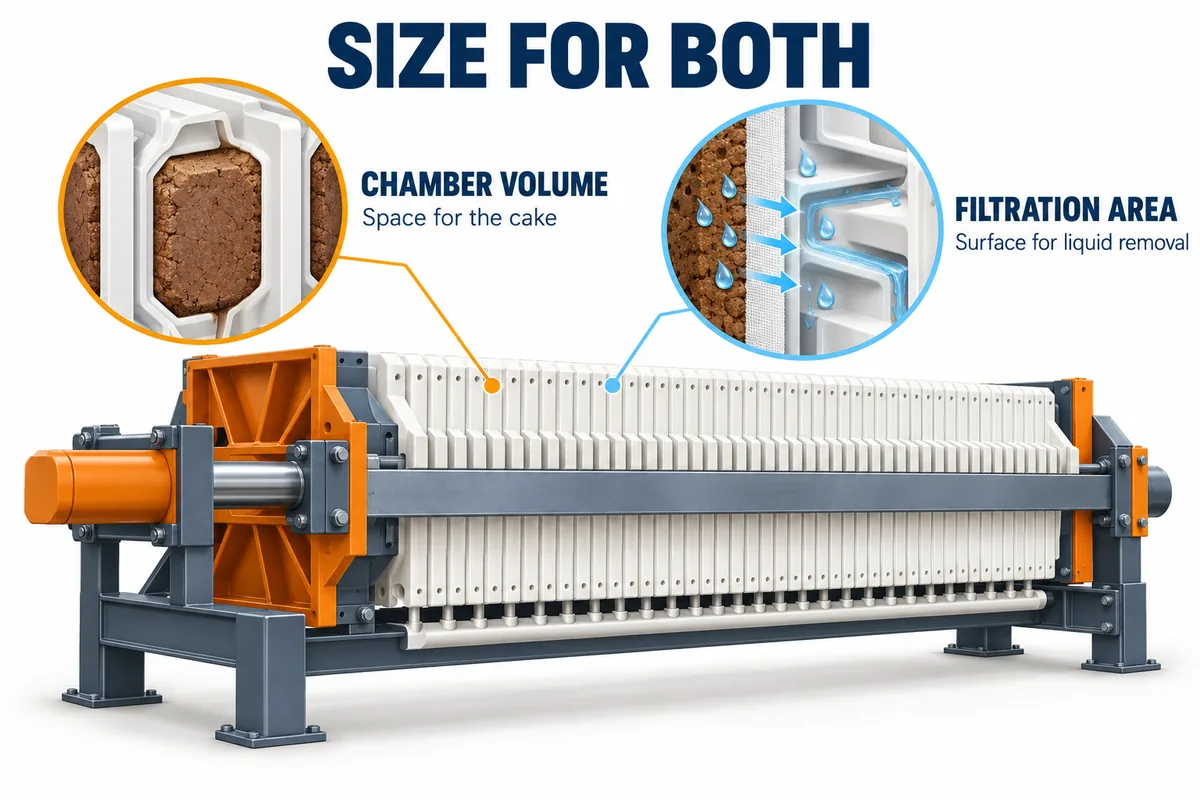
How to choose filter press size
1. Collect the process data that determines capacity
Start with feed volume, solids concentration, slurry density, achievable cake solids, and available operating time. These inputs tell you how much material the press must separate and how much time it has to do the job.
Before requesting a quotation, collect:
- Throughput: normal and peak slurry volume per day or batch.
- Feed solids: dry suspended solids as a percentage of total slurry mass.
- Slurry density: measured at a representative operating temperature.
- Cake properties: dry solids percentage and wet bulk density from the same test endpoint.
- Working schedule: staffed hours, planned cleaning, maintenance, and shutdown periods.
- Separation targets: cake moisture, filtrate quality, and any cake washing requirement.
- Slurry behavior: particle size, compressibility, viscosity, abrasiveness, and tendency to stick to cloth.
- Chemistry: pH, temperature range, and conditioning chemicals or filter aids.
For wastewater biosolids, the U.S. EPA’s filter press design criteria call for daily solids quantities, thickened feed volume, seasonal variation, feed concentration ranges, and future increases. EPA also recommends pilot testing to obtain important design data. Use that checklist to define your operating range before selecting equipment.
Use representative samples. A sample from a quiet production period may miss the fine particles, chemical changes, or high solids loads that cause your hardest operating days. For wastewater and sludge dewatering, record the sludge source and conditioning method alongside each sample.
Keep feed solids and cake solids separate
Feed solids describe the slurry entering the press; cake solids describe the dewatered material leaving it. Both percentages are essential, but they belong in different parts of the calculation.
A feed containing 5% dry solids carries 5 kg of solids in every 100 kg of slurry. A cake containing 35% dry solids carries 35 kg of solids in every 100 kg of wet cake.
When moisture is expressed on a wet mass basis, 35% cake solids means 65% moisture. Confirm that basis with the laboratory before using its result.
Also distinguish suspended solids from dissolved material that may pass into the filtrate. A total-solids result that includes dissolved salts can overstate the solids the press will capture.
2. Calculate your daily dry solids load
Multiply slurry volume by slurry density and feed solids mass fraction to calculate the dry solids entering the press. Add retained conditioning solids or filter aid when those materials are not already included in the measured feed.
Daily dry solids = daily slurry volume × slurry density × feed solids fraction
For the example:
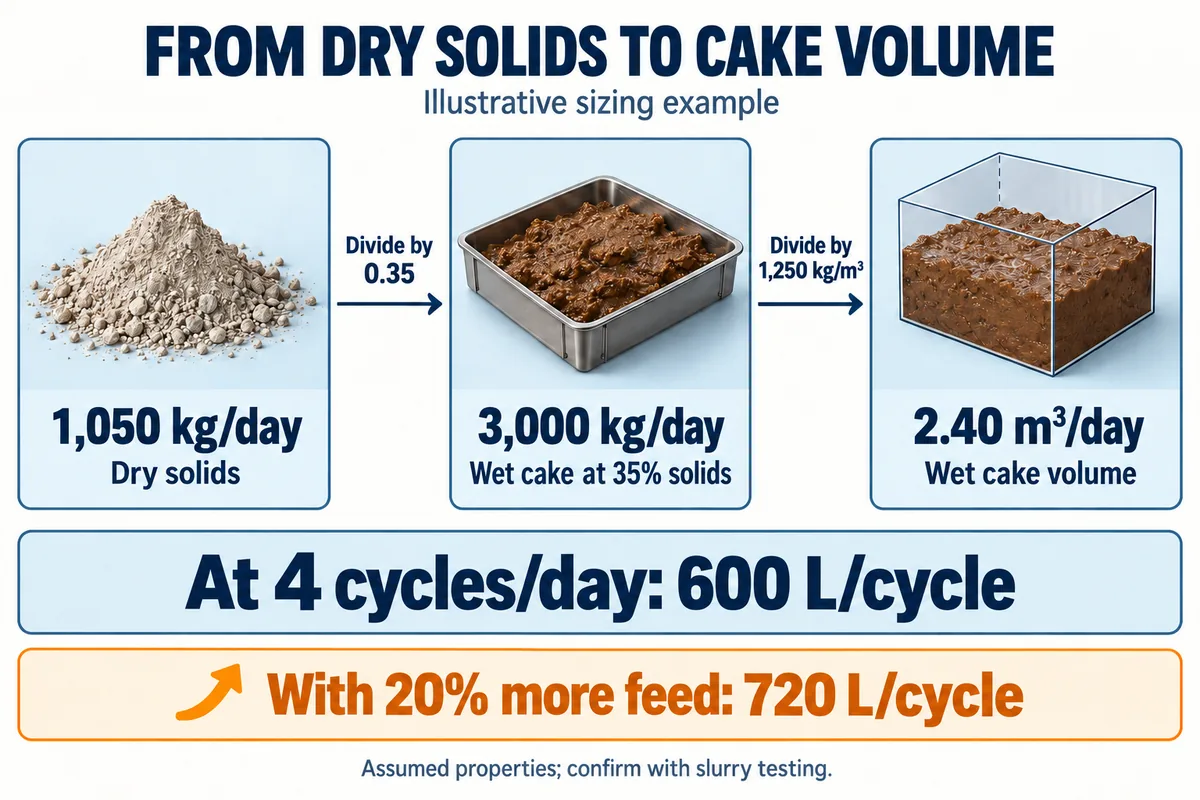
20 m³/day × 1,050 kg/m³ × 0.05 = 1,050 kg dry solids/day
Enter 5% as 0.05, not 5. That small spreadsheet mistake produces a result 100 times too large.
The calculation assumes essentially all of those suspended solids reach the cake. If measured capture is lower, include the solids leaving in the filtrate and any recycle stream in the balance. Poor capture should not become a reason to buy a smaller press.
Define a realistic design load
Use an agreed peak operating case to set the design load, with any growth allowance documented separately. A blanket percentage cannot account for every change in slurry behavior.
Suppose the example plant needs to handle 20% more slurry, while density and solids concentration stay unchanged:
1,050 × 1.20 = 1,260 kg dry solids/day
That is the design case used below. The 20% allowance is illustrative, not an industry rule.
If the peak comes from a higher solids concentration instead of more slurry, recalculate the liquid balance too. Those two scenarios can require different combinations of chamber volume and filtration area.
3. Convert dry solids into cake volume per cycle
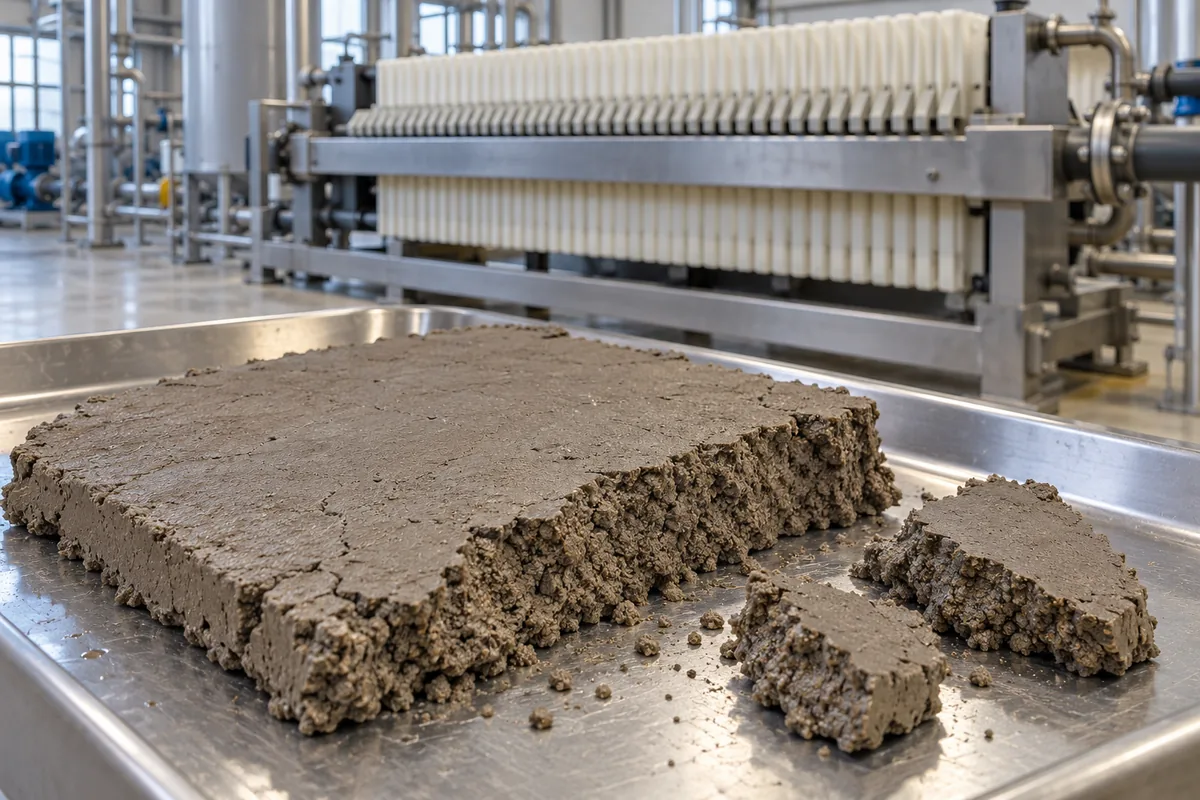
Divide dry solids mass by cake solids fraction to find wet cake mass, then divide by wet cake bulk density to find cake volume. Finally, divide by the number of batches you can actually complete.
The calculation has three parts:
- Wet cake mass = dry solids mass ÷ cake solids fraction
- Wet cake volume = wet cake mass ÷ wet cake bulk density
- Cake volume per cycle = daily wet cake volume ÷ completed daily cycles
At normal load:
- Wet cake mass: 1,050 ÷ 0.35 = 3,000 kg/day.
- Wet cake volume: 3,000 ÷ 1,250 = 2.40 m³/day.
- Volume across four cycles: 2.40 ÷ 4 = 0.60 m³/cycle, or 600 L/cycle.
At the design load:
1,260 ÷ 0.35 ÷ 1,250 ÷ 4 = 0.72 m³/cycle
So the preliminary requirement is 720 L of usable chamber volume per cycle. For comparison, that’s approximately 25.4 ft³.
Use the density of the wet cake at the specified moisture content. The density of the dry mineral particles is a different property and will give the wrong volume.
Check what happens if the cake is wetter
A lower cake solids percentage increases wet cake mass for the same dry solids load. Its effect on required volume also depends on the corresponding cake density.
At 1,050 kg dry solids/day, a 25% solids cake weighs 4,200 kg/day. The 35% solids cake weighs 3,000 kg/day. That’s 1,200 kg more wet material each day at the lower dryness.
For a simple sensitivity check, holding density at 1,250 kg/m³ would increase normal cake volume from 600 to 840 L/cycle. In an actual test, measure density again at the wetter endpoint.
For membrane filter presses, check the filling stage separately. Final squeezed cake volume can be smaller than the chamber volume needed before squeezing. Have the supplier relate the tested dry solids loading to its filling and squeeze sequence.
4. Count complete cycles within your working day
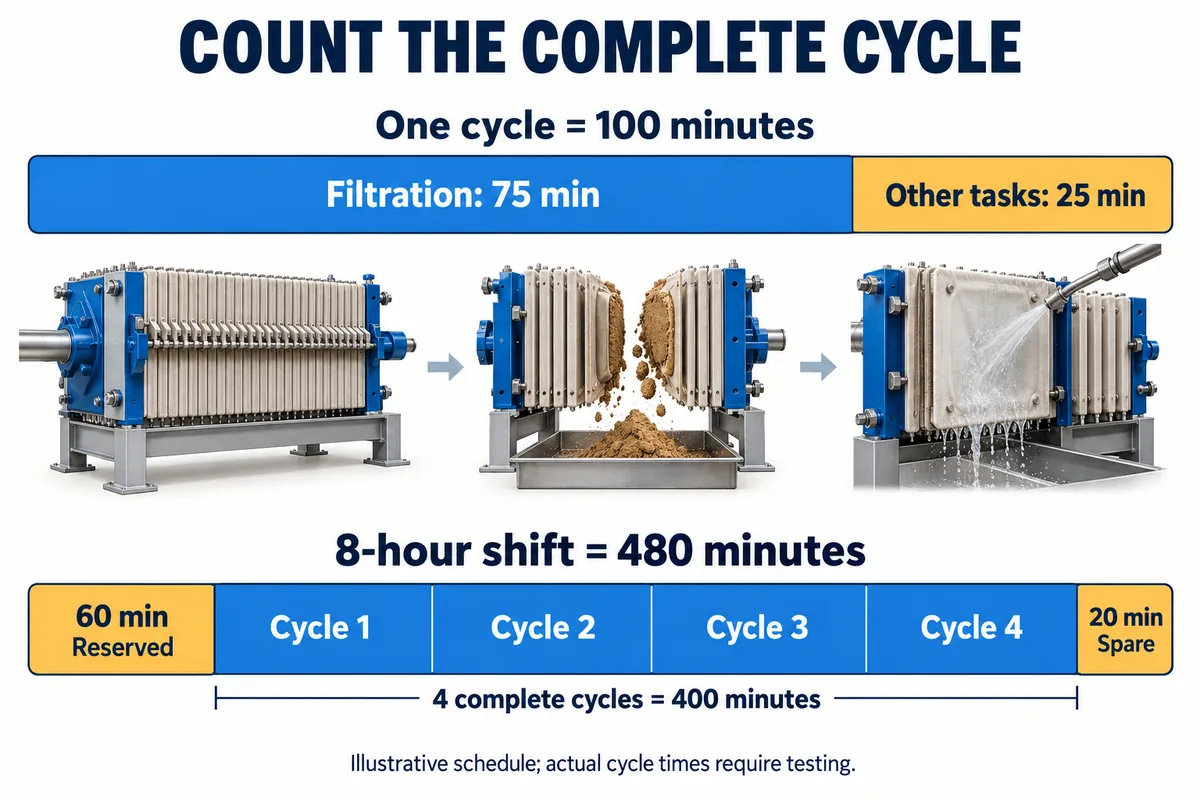
Use the full batch cycle, including filling, filtration, discharge, and recurring support tasks, to estimate daily output. Pumping time alone will overstate capacity.
Include every applicable stage:
- Closing and clamping the plate pack.
- Filling and pressure filtration.
- Membrane squeezing, cake washing, or air drying.
- Depressurization and core clearing.
- Opening, plate shifting, and cake discharge.
- Routine inspection and cleaning.
Some stages overlap. Use the actual operating sequence so time is neither omitted nor counted twice.
For the example, assume an eight-hour shift with one hour reserved for activities outside the recurring batch cycle. That leaves 420 minutes.
If a complete cycle takes 100 minutes, the press can finish four cycles, with 20 minutes remaining. If the cycle takes 120 minutes, it can finish only three within that window.
The design chamber requirement then rises from 720 L to 960 L per cycle for the same daily solids load.
That’s a 33% increase caused entirely by the schedule.
Do not assume that a bigger chamber will preserve the original cycle time. Check the revised geometry and operating sequence with the supplier. Micronics’ sizing guidance explains how feed time, cake moisture, cloth selection, and operating constraints affect the final choice.
5. Run a Filter Press Sizing Calculation for filtration area
Estimate filtration area by dividing the filtrate volume per batch by the tested average filtrate flux and the time available for filtration. The volume and flux must describe the same liquid stream and operating stage.
Required area = filtrate volume per batch ÷ (average filtrate flux × filtration time)
Flux means liquid flow per unit of active filter area. For example, 2 L/m²/min means an average of two liters passing through each square meter every minute over the defined test interval.
This is a preliminary scaling check. The University of South Carolina’s plate-and-frame filtration laboratory manual, in its Theory and Filter Press Design sections, separates filter-medium resistance from cake resistance and explains how cake buildup changes the flow. That’s why the initial flow rate is a poor substitute for an average measured through the target endpoint. The manual also shows why the pump curve and filter resistance must be considered together.
Calculate the liquid that must leave the cake
For a simple water-based slurry, subtract the water retained in the cake from the water entering with the feed. This avoids treating the entire slurry volume as filtrate.
At normal load, assume complete suspended-solids capture, no wash water or other liquid additions, and water density of approximately 1,000 kg/m³:
- Feed mass: 20 × 1,050 = 21,000 kg/day.
- Water in feed: 21,000 − 1,050 = 19,950 kg/day.
- Water in cake: 3,000 − 1,050 = 1,950 kg/day.
- Filtrate water: 19,950 − 1,950 = 18,000 kg/day, or approximately 18 m³/day.
Across four cycles, that’s 4.5 m³ of filtrate per cycle.
For the design case of 20% more feed at unchanged properties, it becomes 5.4 m³/cycle. Processes involving dissolved solids, nonaqueous liquids, washing, or significant recycle need a more detailed balance.
Use flux measured under matching conditions
Use an average flux established with the proposed cloth, pressure profile, cake thickness, temperature, and target dryness. A flux measured on an easy slurry cannot reliably size a press for a difficult one.
For illustration only, assume an average flux of 0.002 m³/m²/min and 75 minutes of filtration within the 100-minute total cycle:
5.4 ÷ (0.002 × 75) = 36 m²
The preliminary requirements are now 720 L of chamber volume and 36 m² of active filtration area. The remaining 25 minutes cover the other batch operations assumed in this example.
The flux here is an assumed value, not a reported test result. Recheck it against the actual cake loading per unit area and selected chamber depth before accepting the cycle time.
Ask the test laboratory to provide the cumulative filtrate volume versus time curve. It shows how quickly performance slows as the cake builds and makes the endpoint easier to evaluate.
6. Translate the requirements into plate size and chamber count
Select a plate configuration that satisfies both total usable chamber volume and active filtration area. The supplier’s plate data should provide the capacity and area contributed by each chamber.
For an illustrative plate configuration, suppose each chamber provides:
- 18 L of usable cake volume.
- 1.125 m² of active filtration area, counting both filtering faces.
The chamber count required by volume is:
720 ÷ 18 = 40 chambers
The chamber count required by filtration area is:
36 ÷ 1.125 = 32 chambers
Choose at least 40 chambers for this preliminary configuration. That gives 720 L and 45 m², so it passes both arithmetic checks.
These per-chamber figures are illustrative, not a manufacturer’s model specification. Ask the supplier to confirm the assembled pack totals, including end plates and any differences in how it counts plates and chambers.
Check cake thickness alongside area
For a simplified recessed chamber filter press with two active filtering faces per chamber, cake volume is approximately total filtration area multiplied by cake thickness and divided by two. This provides a useful geometry check.
Cake volume ≈ filtration area × cake thickness ÷ 2
For the example configuration:
45 m² × 0.032 m ÷ 2 ≈ 0.72 m³
Real plate geometry includes ports, sealing lands, and support features, so use the supplier’s stated usable values for selection.
Micronics’ sizing chart uses 32 mm cake chambers as its stated basis. That makes 32 mm a reference point for that chart, not a universal optimum.
Thicker chambers can hold more cake for a given area, but the longer drainage path may extend filtration time. Test alternative thicknesses when throughput is tight.
Separate sealing, squeezing, and automation
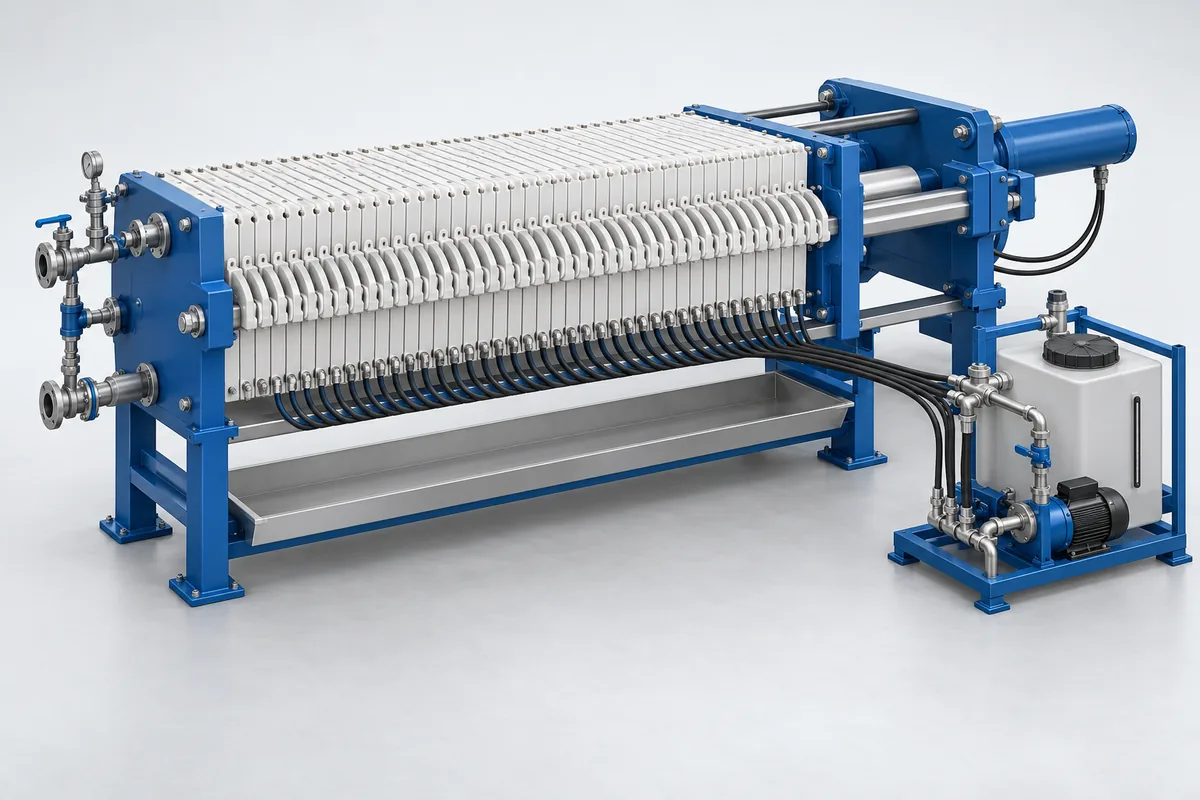
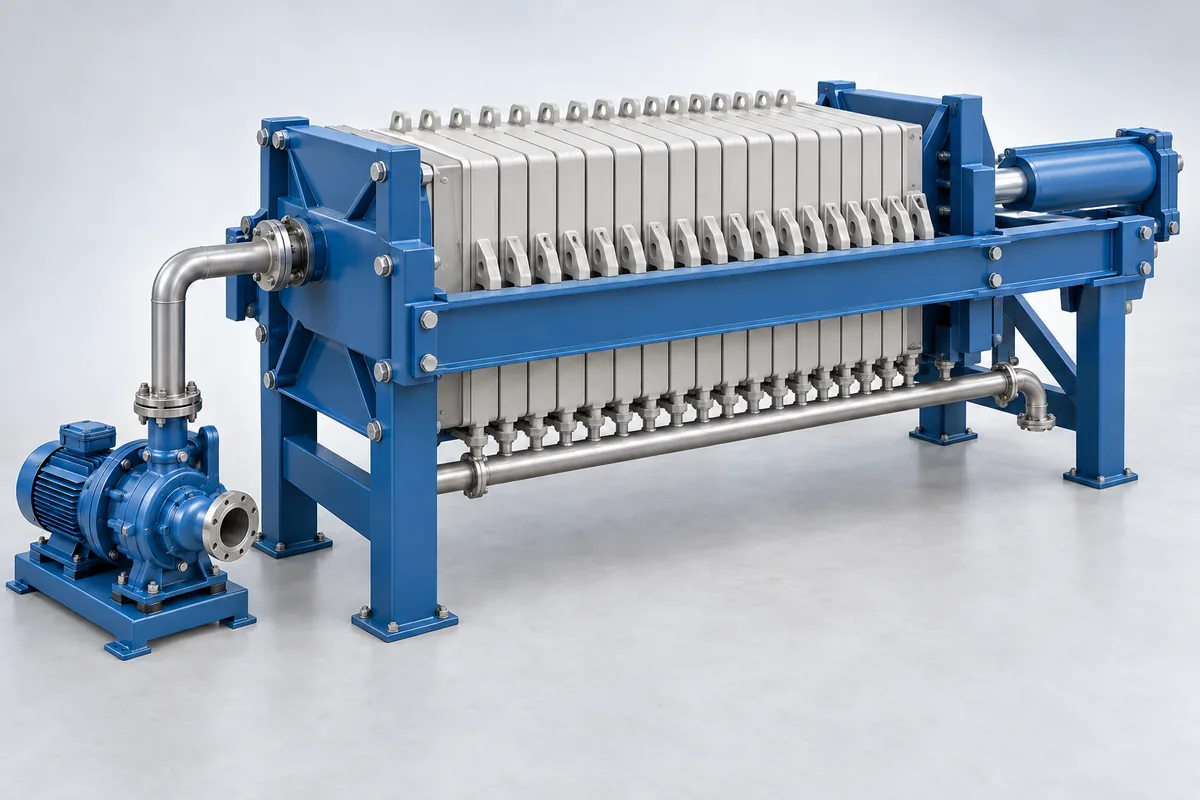
Gasket design affects sealing, membrane plates add a squeeze stage, and automation changes how operating tasks are performed. Each choice needs its own evaluation. The filter press types guide explains how plate arrangements differ from automation and material options.
As Micronics explains, CGR means caulked, gasketed, and recessed. The acronym describes plate construction and sealing; chamber depth still needs to be specified separately.
Membrane squeezing may improve dryness or change the most economical filtration endpoint. Automatic plate shifting may reduce discharge time. Neither benefit should be treated as a fixed percentage improvement without evidence for your process.
7. Check the pump, layout, and operating cost
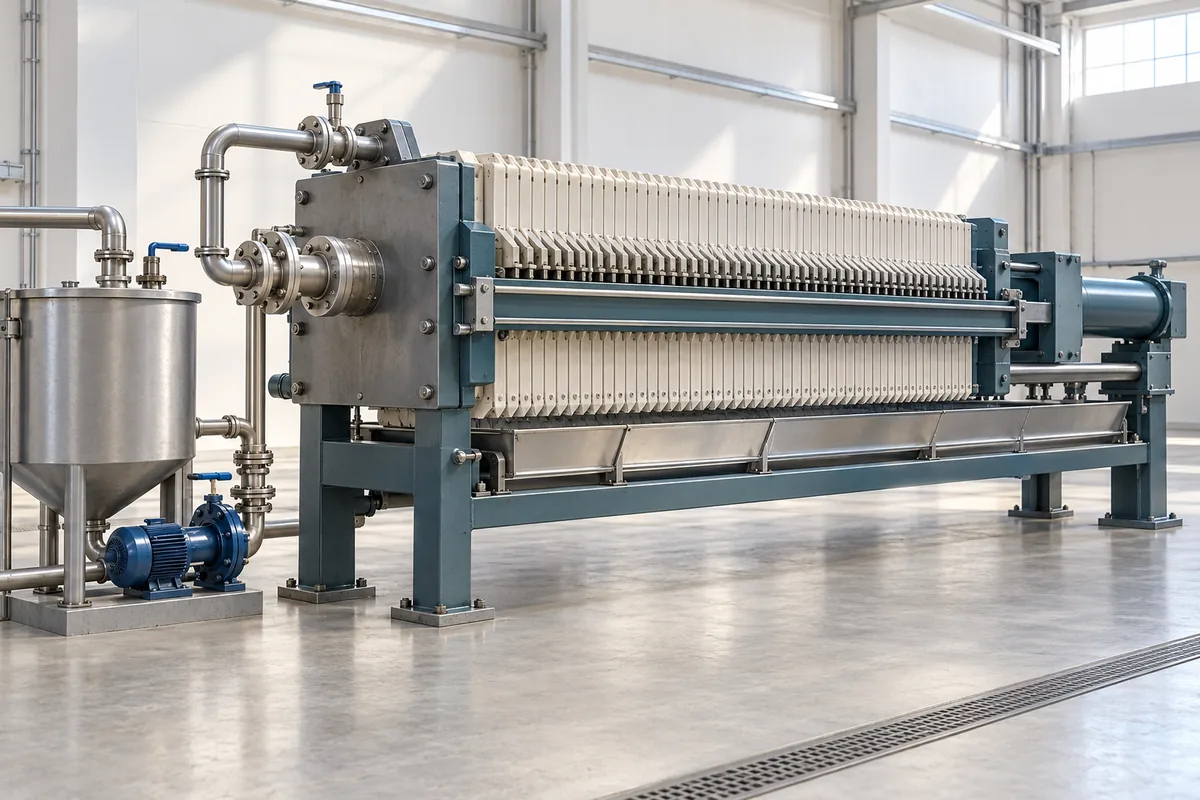
A correctly sized press needs a feed system, installation space, and cake handling arrangement that support its promised output. Check these before choosing between quotations.
Review the feed pump’s flow and pressure across the batch. A pump’s free-discharge flow does not tell you how it will perform as filtration resistance rises.
Also confirm:
- Space to open the plate pack and replace plates or cloths.
- Access for operators, cleaning, and maintenance.
- Clearance for cake discharge, bins, or conveyors.
- Feed storage while the press is unavailable for filling.
- Filtrate collection and cloth wash drainage capacity.
- Suitable plate, cloth, gasket, and piping materials.
- Pressure and temperature ratings for the complete system.
The EPA fact sheet’s operation and maintenance discussion highlights regular attention for filling and unloading, plus records of chemical dose, pressing time, and filtrate quality. Its cost categories include conditioning chemicals, cloth washing and replacement, and operator activity. Obtain current prices for your own plant when comparing quotations.
Compare operating cost per tonne of dry solids processed. Include labor, conditioning chemicals, cloth replacement, energy, maintenance, and wet cake disposal.
For example, saving purchase cost with manual discharge can be expensive if limited staffing prevents the fourth daily batch. Put that lost capacity into the comparison.
8. Validate the selection with a useful test report
Confirm the proposed press with representative slurry testing and a written performance basis. A useful report connects dry solids throughput, cake moisture, filtrate quality, and complete cycle time under stated conditions. A laboratory filter press can help compare media and observe cake formation when its pressure range and configuration match the intended test.
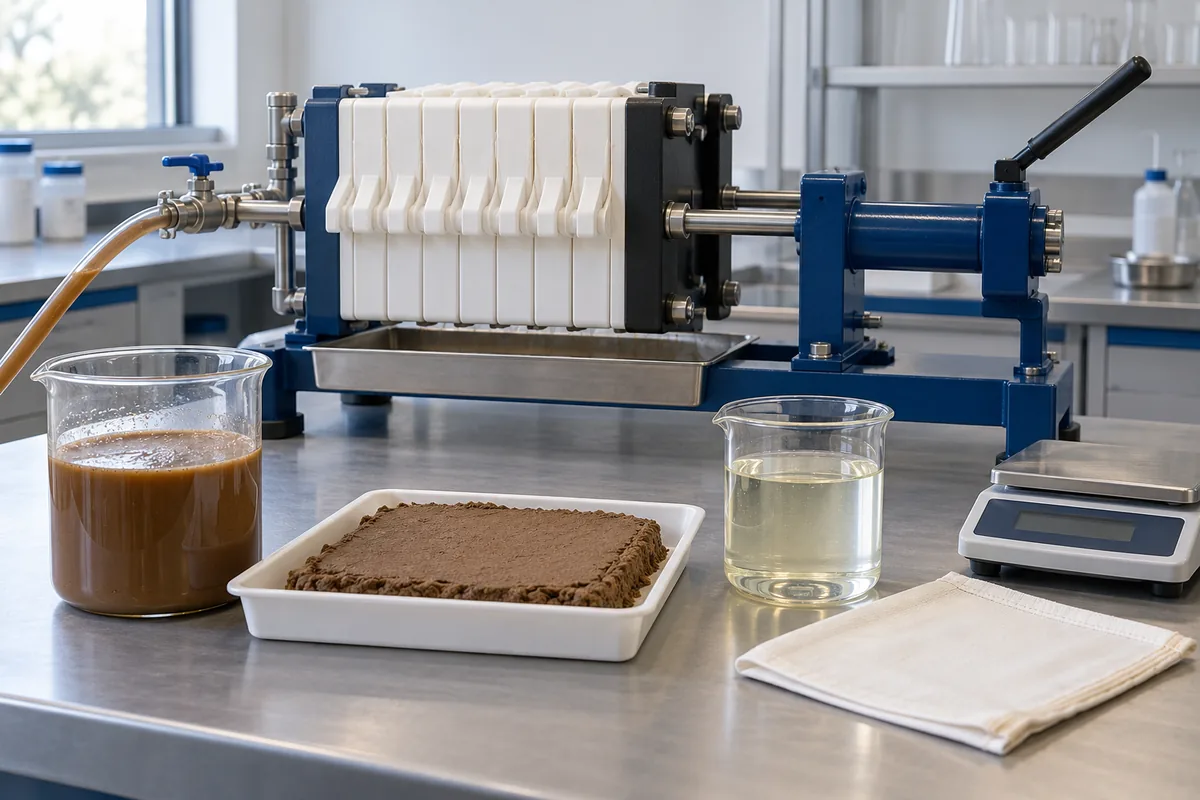
I’d ask each supplier to document:
- The feed composition and concentration range covered by the proposal.
- The cloth, chamber depth, pressure profile, and conditioning used in testing.
- Cake solids, wet cake density, and cake release behavior.
- Filtrate quality and how any initial cloudy filtrate is handled.
- Filtration time, discharge time, cleaning frequency, and other cycle stages.
- Expected daily dry solids throughput at the agreed operating schedule.
- The method and limitations used to scale laboratory results to the full press.
Test difficult conditions as well as normal ones. Fine particles, compressible sludge, colder feed, or sticky cake can change the result even when daily slurry volume stays the same.
For wastewater solids, EPA specifically recommends representative bench testing when comparing membrane and fixed-volume presses, along with an economic analysis of the added equipment cost.
Check turndown too. A press selected for peak production still needs an operating method for smaller batches. Partial filling, squeeze operation, and any future plate changes require the manufacturer’s guidance.
This guide uses mass balances and linked manufacturer guidance for preliminary selection. The worked example is hypothetical; the final performance basis must come from your process data and an agreed equipment evaluation.
Make your final selection with a clear specification
Choose the press that meets the required cake volume, tested filtration duty, complete cycle schedule, and installation constraints together. Record the assumptions so different suppliers quote against the same job.
For the worked example, the preliminary design calls for 720 L per cycle, at least 36 m² of filtration area, and four complete cycles per day. The illustrative 40-chamber configuration provides 720 L and 45 m², subject to testing that confirms the cycle and cake targets.
Your next step is straightforward: prepare the feed data, test representative slurry, and request a filter press proposal with explicit performance conditions. That gives you a practical, evidence-based answer to how to choose filter press size.